Territorial cohesion in the Baltic Sea Region: a multidimensional analysis
In an attempt to synthesize the various patterns and trends in the Baltic Sea Region (BSR) into one compact and coherent package, we utilize 10 specific macro-level indicators that cover all major aspects of territorial cohesion in the BSR. These are concerned with 'distribution', 'convergence' and specifically 'targeted BSR cohesion topics'. The 10 indicators reveal that during the latter half of the past decade, the BSR underwent a process of increased concentration of economic value-added, jobs, and population at a macro level.
The main perceived division in the BSR in the 1990s was between the east and west, stretching from the White Sea to the Bay of Pomerania. In addition, only a few scattered material welfare pockets were discernible, primarily around capital regions such as Tallinn or Warsaw, and to a lesser extent, approximately 10 other major urban nodes.
In subsequent years, this overarching pattern has changed. Arguably, the strong east–west division across the Baltic Sea still exists, but it already has a few "cracks", such as along certain stretches of the Finnish-Russian border (Figure 1). The greatest difference from the situation 15–20 years ago is a virtual explosion of disparities between adjacent regions within countries, in particular in the eastern BSR.
A vast assortment of new 'islands of wealth' has emerged, typically surrounding major metropolitan areas. Moreover, other internal discrepancies are now much sharper than was previously the case. The most striking case in the eastern BSR is the increased regional disparities in BSR Russia. On average, economic border disparities in the eastern BSR are 10 percentage points greater than those in the western parts of the region. Increasing polarization in the Nordic countries is evident, and is similarly manifested in growing intraregional disparities.
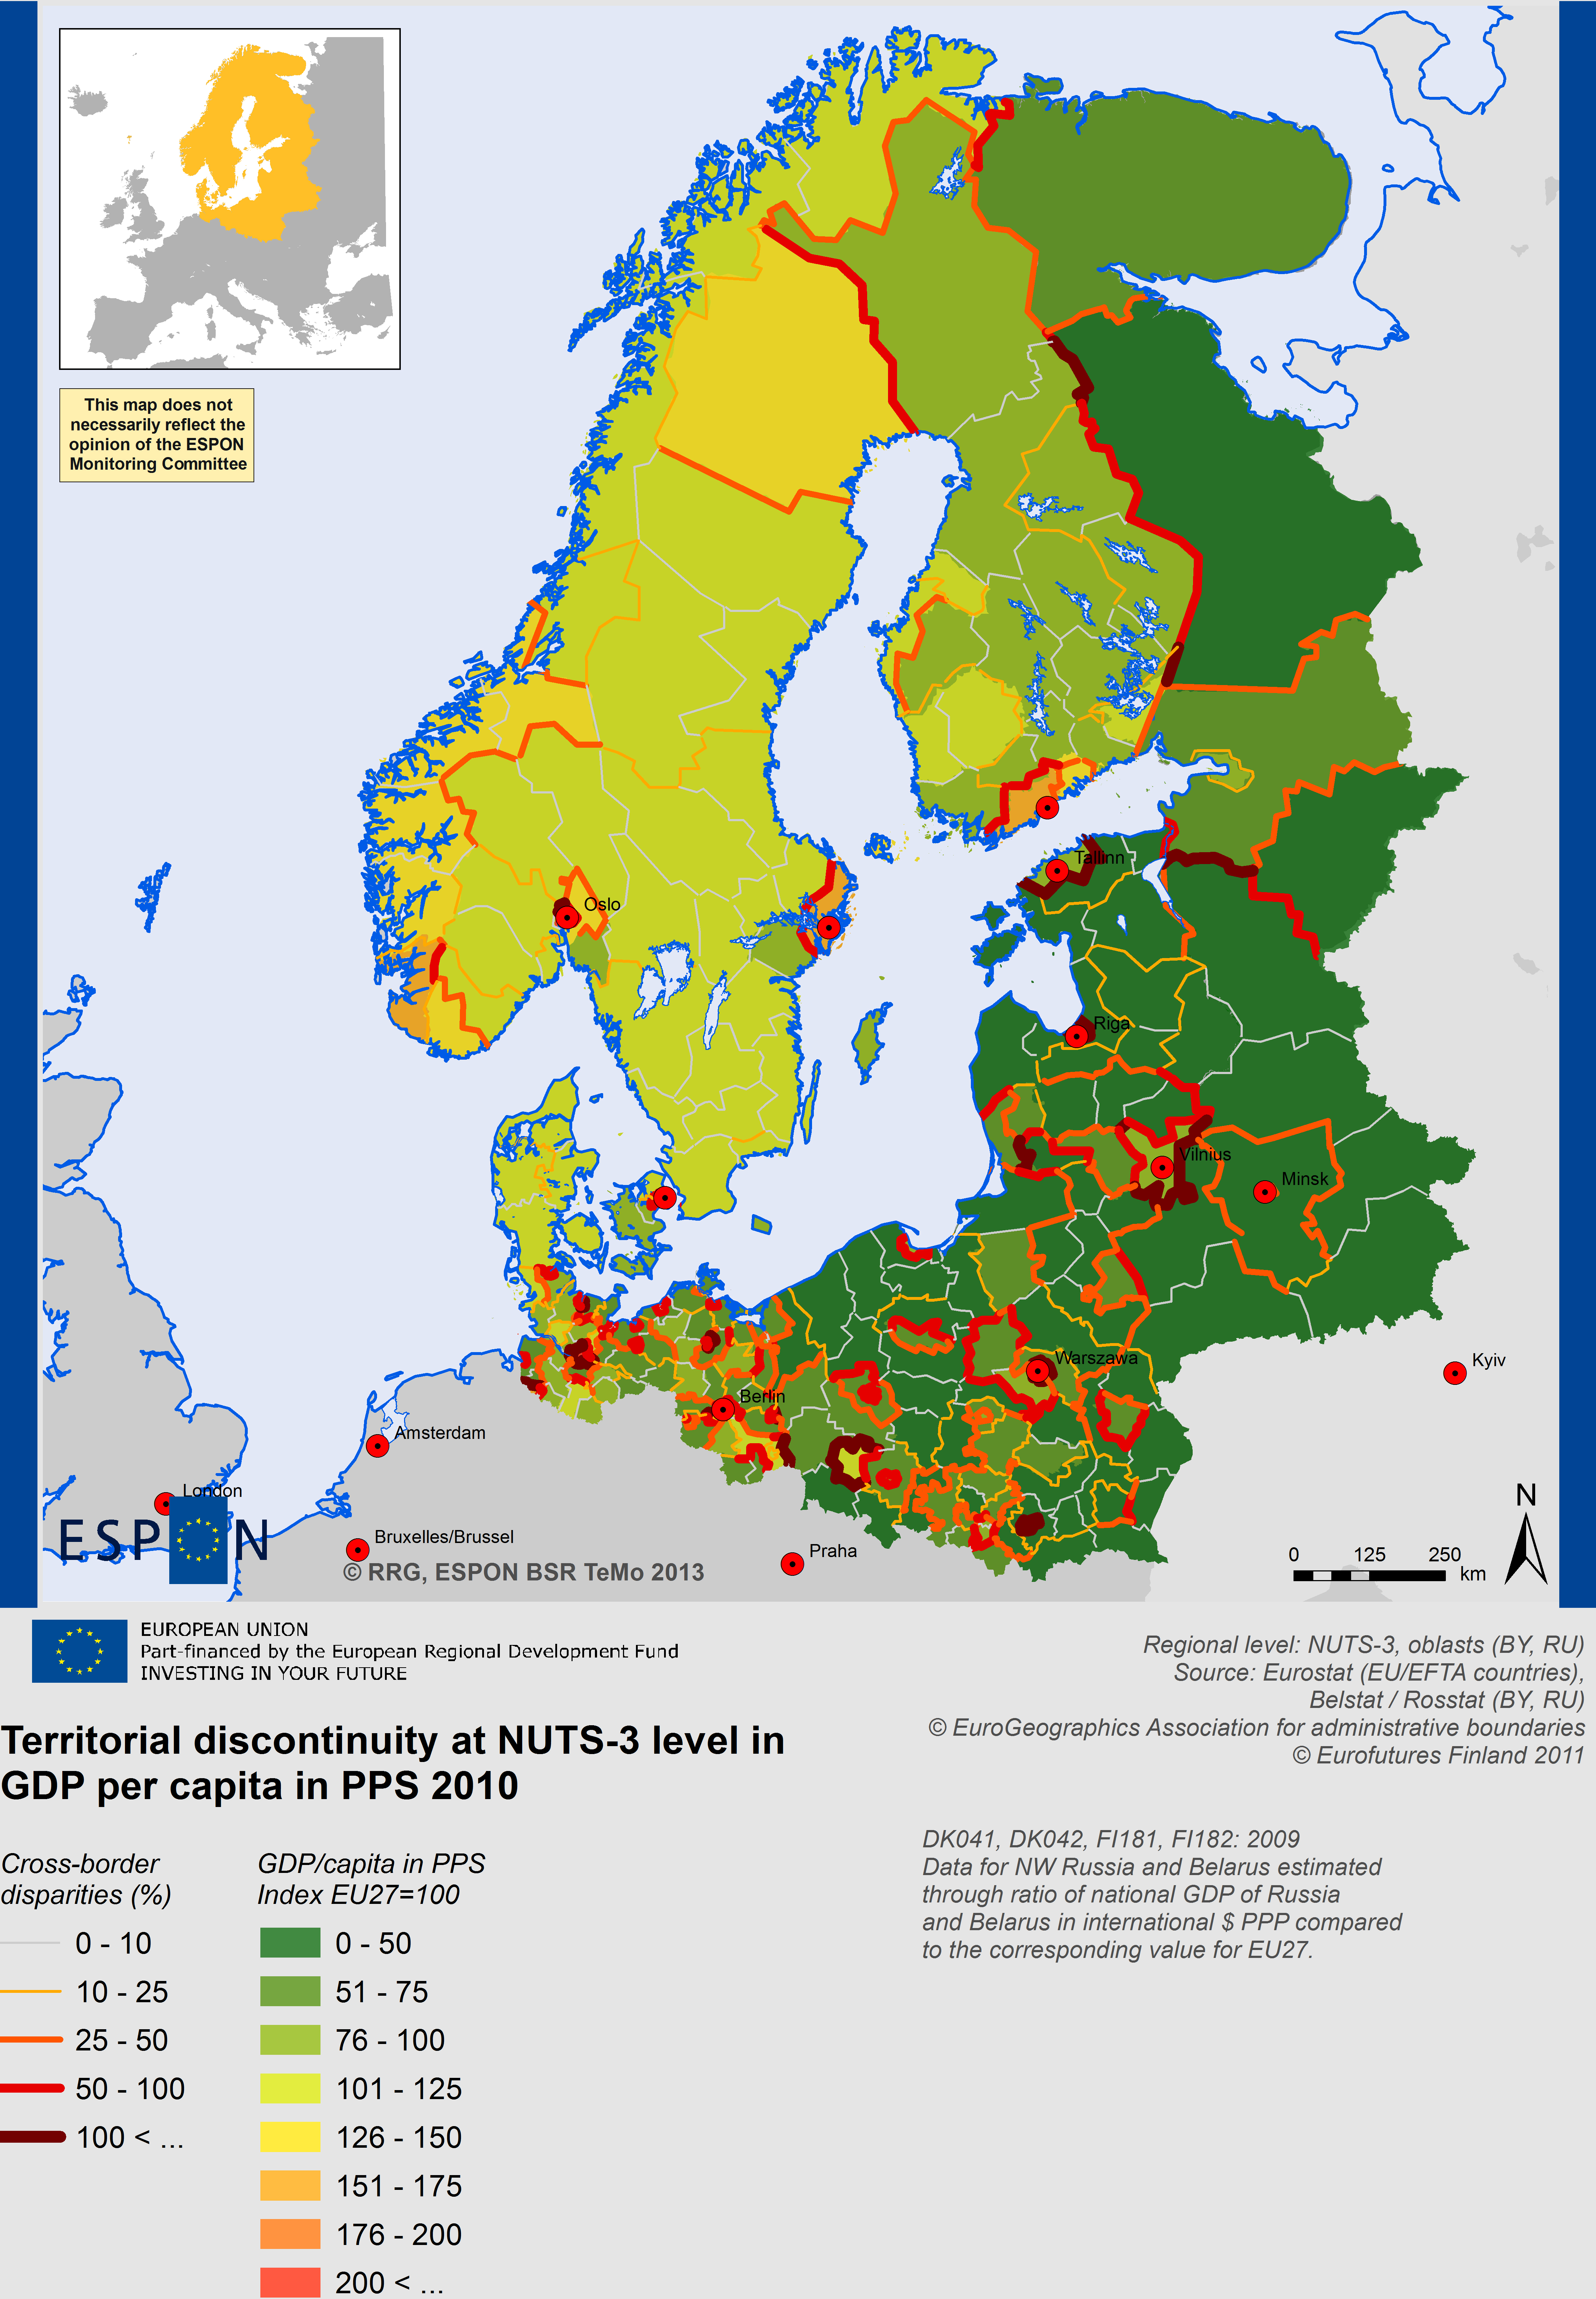
Figure 1. In contrast to the situation in the past, there are now substantially higher barriers between all capital regions and their surrounding areas.
Examination of local disparities in unemployment rates shows similarly that in the social context, the patterns are substantially different. First, the primary divide appears to be between countries rather than within them, reflecting a situation where labour market policy in general is more a national than a regional affair. Second, because high unemployment (as well as other related social challenges) does not conform to the urban–rural dichotomy (i.e. the urban paradox), for the most part, we see no particularly large discrepancies between major metropolitan areas and their surrounding territories.
Analysing the BSR divides
The indicators reveal that the BSR east–west divide is still in existence; however, particularly in issues related to economic development, it is steadily being eradicated. The sharpest divide today is discernible within the social sphere of development.
The BSR has huge internal variations in terms of well-being and quality of life. However, the development trends are cohesive, and in tandem with reduced economic differences, they tend to be reduced over time. Yet east–west differences in such a significant area as life expectancy are still substantial. Levels of relative poverty are somewhat comparable between east and west: in 2010, they included a fifth of the population of the western BSR and close to a third on the eastern side. In contrast, it is not surprising that there are huge east–west variations in levels of absolute poverty. For instance, in terms of severe material deprivation, more than 30% of the population of some eastern BSR regions in 2011 were deprived of many basic amenities. The highest corresponding regional value in the western BSR only reached 3.8% of the population.
Somewhat surprisingly, in terms of self-assessed general health, the east–west divide is not as clear. Economic welfare only partially explains patterns in health (Figure 2). Changes in the health status of the BSR population tend to level out on a large scale. By and large, we find that the worst performers have improved their relative status to the greatest extent, and the best performers the least.
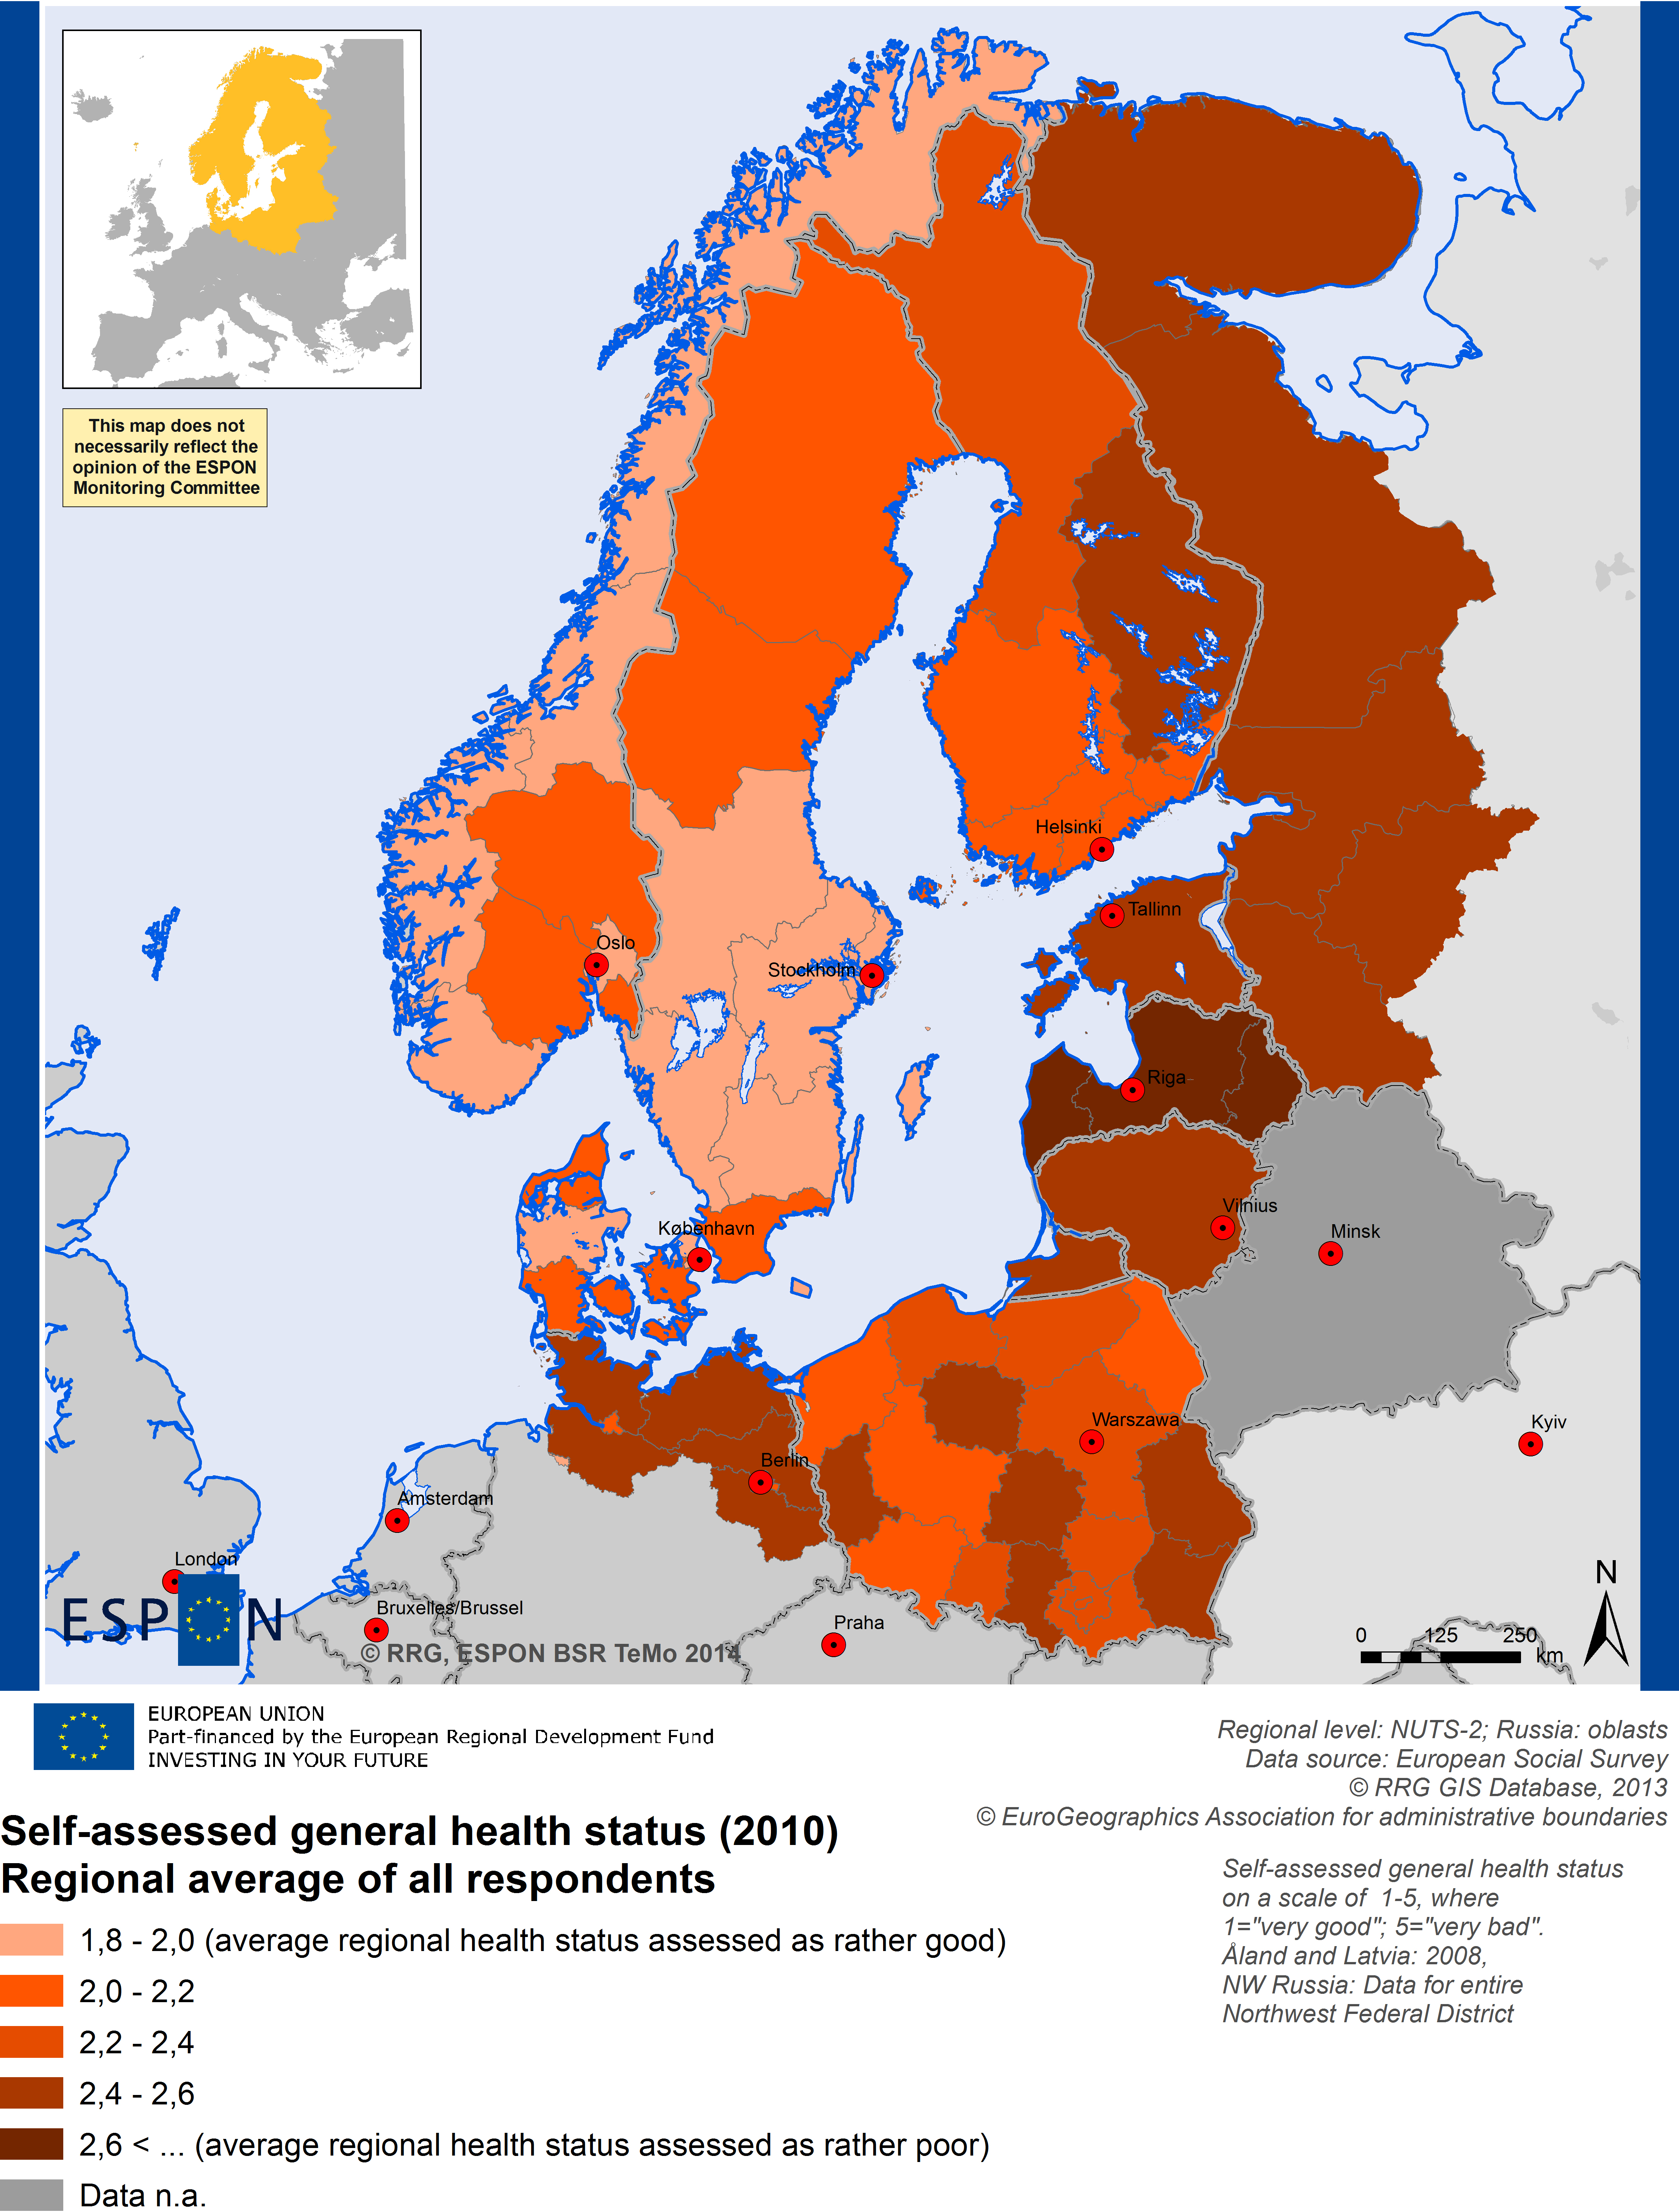
Figure 2. Self-assessed general health status does not show a clear east–west divide.
Concerning the north–south divide, sparsely populated regions (together with border regions) are generally the most disadvantaged types of territories and lag behind in most aspects of socio-economic development, particularly in a national context. Evidence for this can be found in migration patterns, weak demographic structures and naturally in physical accessibility. On this last point, recent changes (2001–2006) indicate that the situation for the sparsely populated areas is worsening despite investment in transport infrastructure.
The last of the three BSR divides is in many respects the most difficult to perceive. Yet it is perhaps the most profound of the three. There are indications of a strengthening of the urban–rural divide, whereby territorial gaps in the BSR are most pronounced in terms of urban hierarchy. With very few exceptions, the rural areas generally occupy the bottom positions in most aspects of socio-economic development. Demographic structures are weak, accessibility measures of rural areas are on average some 20% lower than the BSR average, and more than 40% lower than urban areas. The core rural areas are handicapped by a lack of opportunities for economic development outside the sphere of primary production, often low levels of education, and substandard infrastructure that results in poor accessibility and connectivity to larger centres, although these are not the most peripheral regions. The financial crisis also appears to have affected rural migration harder than in any other type of region.
Migration and jobs: a story of increased polarization
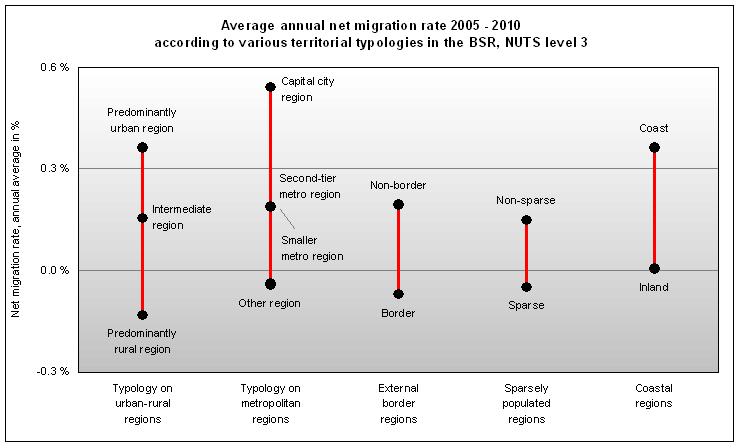
As has been the case for the past 20 years or so, recent trends in general territorial development indicate increasing polarization. At a general level, this polarization looks surprisingly similar across most domains of society. It includes areas such as demography, economic development, economic vulnerability, innovation, entrepreneurship, the knowledge economy and social development. The general pattern of this ongoing development in the BSR is appropriately illustrated by Figure 3, which shows average net migration rates for various types of BSR territories in the period 2005–2010.
Data source: Eurostat, Belstat, Rosstat. NW Russia: 2005–2009; Finland & Denmark: 2007–2010.
Figure 3. Differences in net migration rates for various types of BSR territories, illustrating a clear trend of polarization.
On the urban–rural axis, predominantly urban regions have taken a clear lead, whereas predominantly rural regions are at the bottom end of the scale. Capital (city metropolitan) areas exceed all other types of regions, and only 10 urban regions (out of 238 regions in total) absorb 47% of all surplus migration in the BSR.
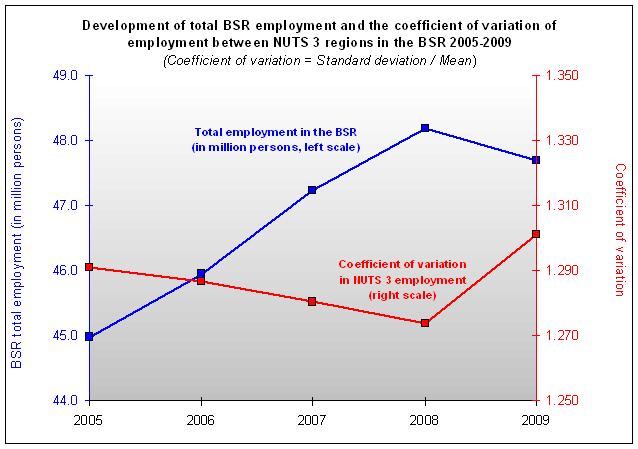
When examining the spatial distribution of economic indicators such as new jobs in the BSR, a further polarizing developmental trend is similarly apparent. Total BSR employment grew continually until 2008, after which it subsequently decreased (blue line in Figure 4). The parallel downward slope in regional employment trends (red line) indicates that when the number of jobs increased in the BSR, the increase was beneficial to most small regions in the area, because intraregional differences were reduced. However, when the number of jobs started to decrease as a result of the financial crisis of 2008, the decrease was not evenly distributed among the regions. This implied a concentration in larger regions, showing the weak resilience of rural and/or peripheral areas in response to external economic shocks.
Data source: Eurostat, Belstat, Rosstat. SNUTS 2 for Belarus and NW Russia.
Figure 4. When the number of jobs (blue line) in the BSR increased, the increase was beneficial to most regions (red line). The decline following the 2008 credit crunch mostly affected more vulnerable regions, resulting in increased concentration of employment.
In terms of locations where these jobs were created, new employment has followed a rather strict hierarchical ranking of settlement types. Capital regions have gained the most jobs, followed by second-tier metropolitan areas. Smaller metro regions have also fared well, but new job creation has not been as rapid in the remaining regions, which are primarily rural and/or peripheral.
However, more alarmingly, the post-crisis loss of jobs indicated a considerable spatially segregated pattern, because the least urbanized areas were hit hardest, revealing the economic vulnerability of smaller settlements in the BSR. During the period 2005–2009, sparse, border and rural regions in particular experienced considerably worse development than their counterparts. That coastal regions on average fared worse than inland regions is to a large extent a result of rapid employment growth in Poland (where most regions are not by the coast). The obvious urban–rural dimension of these typologies requires further examination. Regarding different forms of metropolitan regions, one may say that the division is between non-urban and urban, but for the latter not in a strictly hierarchical manner. The heterogeneity of the BSR implies that the size of the metropolitan area in itself appears to be of lesser importance, and other factors have greater relevance.
Territorial diversity
In recent years, the issue of recognition of territorial diversity has attracted increased attention and has substantial relevance for the BSR, because the region is in this respect extremely heterogeneous in character.
In general, border regions still today perform worse than the rest of the BSR and they are particularly severely handicapped when examined in their national context. Net migration into external border areas is down to less than half that of their respective countries, unemployment rates are higher, GDP/capita is lower and accessibility is much worse. They also appear vulnerable to external economic shocks. Following the economic crisis of 2008, border regions have experienced a much steeper fall in economic indicators such as migration or a much larger relative decline in employment than the non-border areas of the BSR.
Specific territories represent not only a burden, but also an asset. For instance, external border regions represent a large economic potential that today still appears under-utilized. In 2009–2010, border regions accounted for more than 13% of the total BSR economic growth surplus, far beyond their relative share of the economy. Similar stories can be told for sparsely populated regions, remote regions and non-metropolitan regions that testify to the untapped potential of the economic contribution of such areas.
Back to Nordregio News Issue 2, 2014