Rankings and indexes are developed for many different purposes. One example from the EU level is the ranking of regions to define eligible areas for structural funds based on GRP levels in the past. National rankings are created to show the most favourable business climate or the best place to live. The purpose of Nordregio’s Regional Potential Index is to show the current performance of the 74 administrative regions of the Nordic countries; to identify regions with high potential for future development and their common denominators; and to identify regions in need of further support and policy measures to strengthen their potential and meet existing challenges. Last but not least, the index provides policy-makers with insights on regional strengths and weaknesses, and could be used for comparative learning between Nordic Regions with similar geographies but different outcomes in the ranking when it comes to creating effective regional development strategies.
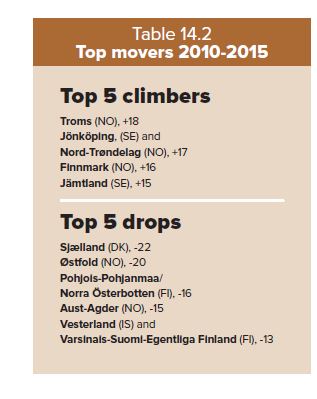
This report gives plenty of insights to what impacts regional development. In previous chapters, we have shown you how the 74 Nordic Regions preform in a range of important indicators. But, which regions stand tallest when it comes to core economic, demographic and employment indicators – and thus have the greatest potential for future growth and development? For the first time in this report series, Nordregio has constructed a Regional Potential Index (RPI) for all 74 Nordic Regions. And the top performer 2015 is Oslo, the Norwegian capital region, closely followed by two other capital regions: Hovedstaden in Denmark and Stockholm in Sweden. Just as interesting though, in terms of future potential, are the fastest climbers in the ranking, for instance the regions of Troms and Nord-Trøndelag in Norway and Jönköping in Sweden.
The ranking results from a Nordic, comparative perspective
Norwegian regions perform well in the ranking overall. We can see some particularly strong results from regions with industries, businesses and services related to oil and gas extraction, a trend that is probably about to break, considering the decreasing oil prices. Denmark and Iceland also have a large proportion of regions with high regional growth potential. In Sweden and Finland the domestic variation between the strongest and weakest regions is greater. Sweden, for example, scored very well around the capital and also along the west coast, while the three south-eastern most regions Blekinge, Kalmar and Gotland, which include Sweden’s largest islands (see figure 14.1) scored relatively poor, largely due to lower scores on economic indicators.
In Finland, many regions received lower rankings, specifically in the eastern and northern parts. The picture here is even more diverse than in Sweden. Some regions scored well on demographic potential but were low on both economy and labour force potential while others scored low on all three dimensions. One thing to remember at this point is that we are studying regions within the Nordic Region which is relatively cohesive compared to many other European regions. Since the ranking is normalised, the regions are allocated scores in relation to the best and worse regions in the sample. That means that the region with the lowest value of an indicator is allocated 10, while the best value is 100. All other values are scored in between those based on relative values of indicators. In short: the difference between regions in the ranking can be perceived as larger than the absolute differences between regions. The reader of the ranking should also be reminded that the ranking is based on data from national statistical institutes, which do not include data on cross-border commuters and business. Consequently, a couple of regions located along national borders (e.g. between Norway and Sweden) would most probably have performed better if cross-border data would have been included.