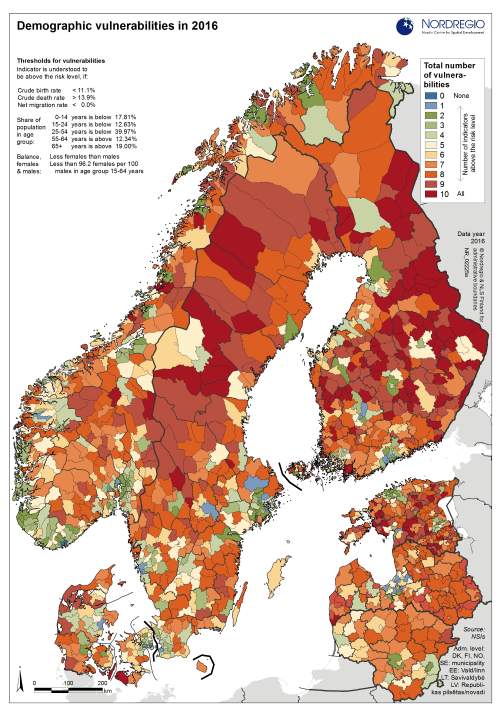
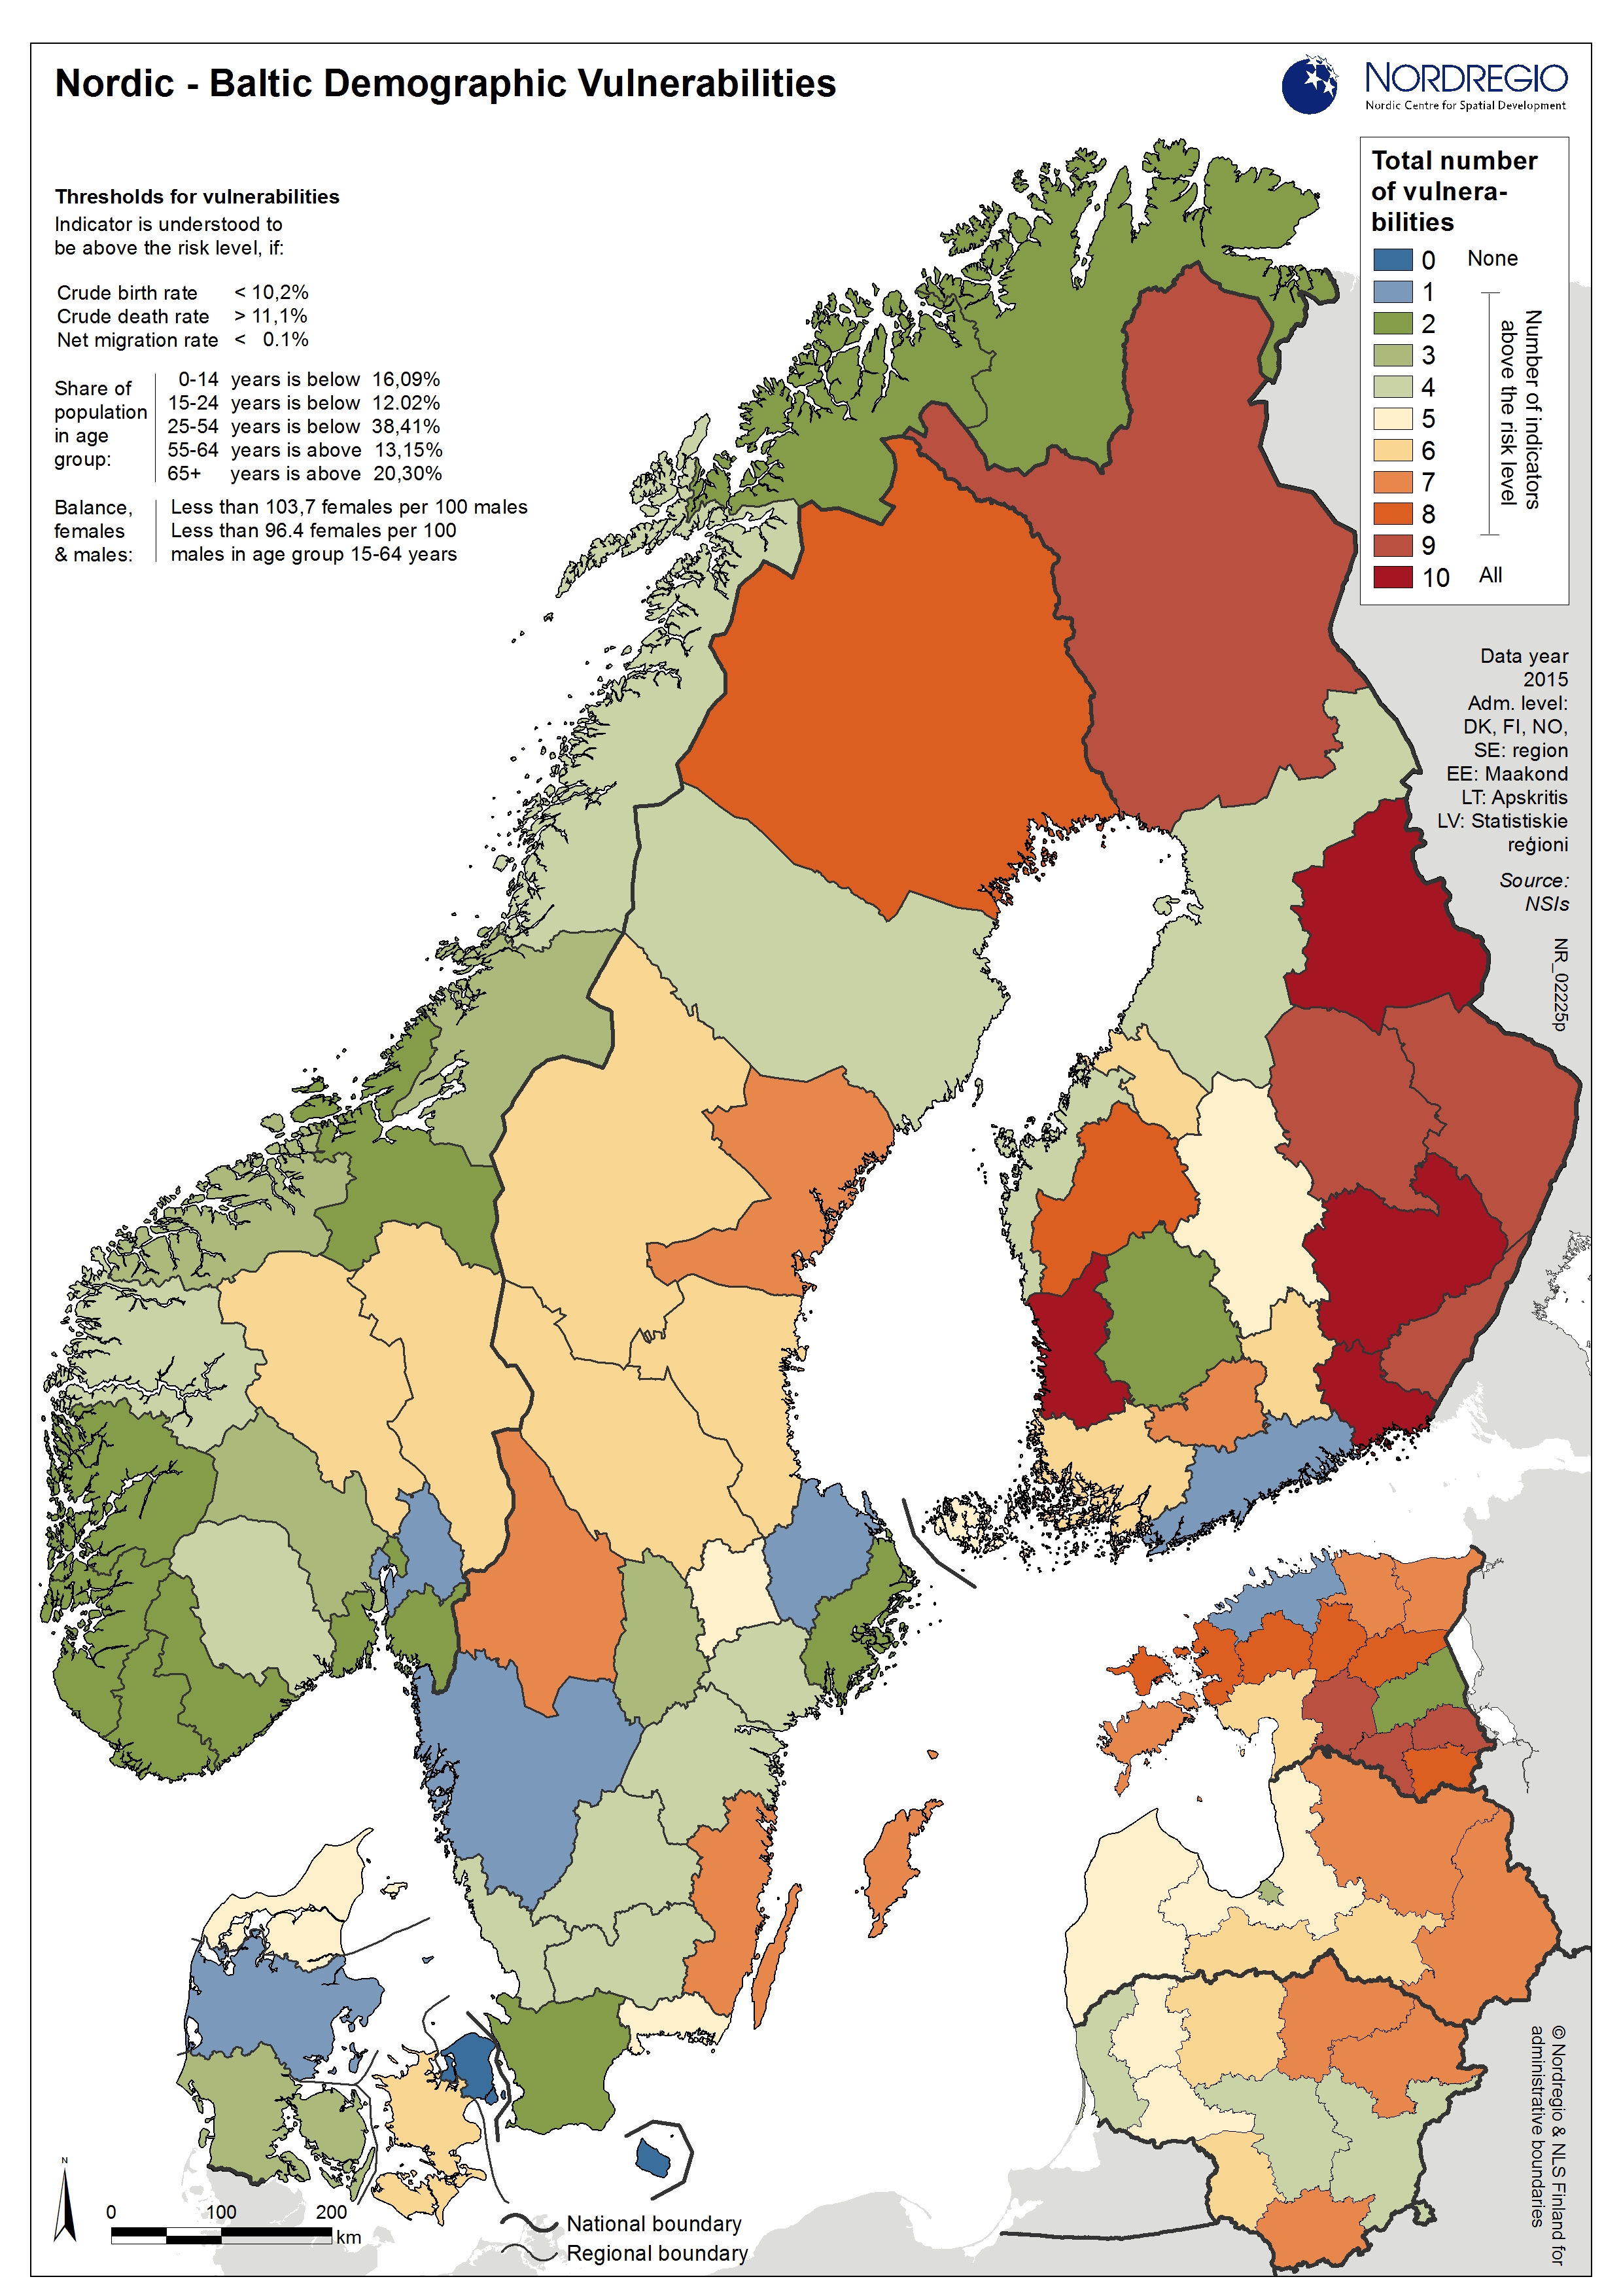
To highlight the demographic diversity across Nordic and Baltic municipalities, Nordregio utilises the concept of ‘demographic vulnerabilities’ based on demographic data; a concept that has been applied to the Nordic municipalities and regions since 2011 and which has in this project been extended to include also the Baltic countries.
On the basis of 10 demographic indicators - five related to age structure, two related to gender balance, two to natural population change and one to migration - map 1 facilitates the understanding of the demographic dynamics that characterises the Nordic-Baltic region. It helps to identify types of municipalities which share common demographic development opportunities, as well as specific challenges. It is however important to bear in mind that the existence of a large number of indicators over the risk level does not necessarily indicate a bad demographic situation but rather it simply illustrates the level of complexity of the specific demographic situation.
The selection of indicators is based on the main demographic concerns that arise in societies characterised by ageing, risk of labour force shortages in the future due to retirement and fewer children, and high migration rates, especially among youth and people in the early working age .
For each of the indicators a threshold value has been calculated, identifying whether or not they can be considered ‘at risk’. For the age indicators the threshold is set on the potential replacement in comparison to a Nordic-Baltic average. For example, if the age group of 0–14 years drops below 17.8% a proper reproduction rate comparable to the Nordic-Baltic average will not be maintained, and the population will drop unless compensated for by other factors such as in-migration. For the other indicators (gender balance, natural population change and migration) the threshold values have been decided in relation to a balanced situation i.e. a female rate below 100 (female shortage) results in a distorted gender structure which reduces the natural reproduction rate, just as it, with the present pattern of educational and occupational choices, will have implications for the potential labour force.
The links to the right bring you to all the maps that have been created, either on municipal level or regional level.

