Urban planners need to somehow juggle these issues through the use of a variety of tools. One of these tools is the so called Land Use Transport interaction (LUTi) model. This is really a family of models that aim to estimate how cities will develop on a long term basis (typically over a period of 30 to 50 years) through the interaction of three main factors: population, land use and transport services. Among the many processes addressed by LUTi models, the main one is perhaps the interplay and feedback of information from the land use system to the transport system and vice versa. This reflects the influence of land use patterns on mobility patterns and the evolution of transport infrastructure in one direction, and in the other direction, how transport systems have an impact on how urban form evolves and how people engage in various land use activities. Typical plans evaluated using this family of models include the estimation of the impacts around a change in transport infrastructure, e.g. a new railway line between two areas, or the building of a new development in the region, e.g. a new industrial estate. This would include economic impacts (regional and/or national), often disaggregated by industrial sectors; and the prediction of diverse data on households, population (by type) and the number of additional jobs for each of the modelled areas.
To gain a better understanding of where urban models might be going in the future, we will first have a look at where they come from and how they have evolved over the years (Wegener, 2010 and EUNOIA position paper).
Historical background
There was a first surge of LUTi models during the 1960s in the US which lasted until the mid 1970s. The main difficulties around this first family of urban models were synthesised by Lee in his Requiem for large-scale models article in 1973 where he listed 'seven sins' of the models from this period: hypercomprehensiveness, grossness, hungriness, wrongheadedness, complicatedness, mechanicalness and expensiveness. This was the rhetoric of those times and in essence, the models did not match up to the intellectual and policy needs for effective forecasting and they were difficult to implement due to limits on data and computer resources. It is therefore not surprising that these kinds of urban model were then more or less abandoned during the late 1970s and 1980s.
However, advances in computing, the birth of Geographic Information Systems (GIS) and better data led to a second surge of urban models during the 1990s. New models advanced from previous implementations by further disaggregating zonal components and also population and employment groups using socio-economic attributes. New modelling techniques were explored, such as discrete choice theory and agent-based modelling. Another important factor was visualisation, which made results more interpretable and thus clearer to wider audiences. In particular, this includes better usability for planning practitioners through what have come to be called planning support systems (PSS). These improvements were further supported in the US and the EU by specific initiatives, which meant that many of these models ended up being applied in an increasing number of cities.
Perhaps the most important advance in recent years has been the adoption of new modelling approaches - amongst which activity-based modelling and microsimulation transport modelling are particularly exciting. At the same time, our evolving knowledge around model development continues to challenge the limits of model computation, which means we are also observing an increasing trend on the parallelisation of processes to run models. Simply put, the sheer amount of calculations within such models, with constant feedback loops from sub-models to other sub-models, means that multiple models are being integrated together in new ways.
Big Data and urban models - The EUNOIA project
Understandably, the Big Data era, where information relevant to urban planning is starting to be available from unconventional sources, has brought integrated urban models back into the spotlight. Data based on crowd-sourcing, remote sensing, online social networking, smart transit ticketing, mobile phone usage and credit card transactions have a common denominator: they all contain geo-located information. As a result, we are moving from structured, static, demographic and economic activity data (e.g. census data) to unstructured, dynamic data able to provide new insights about urban dynamics.

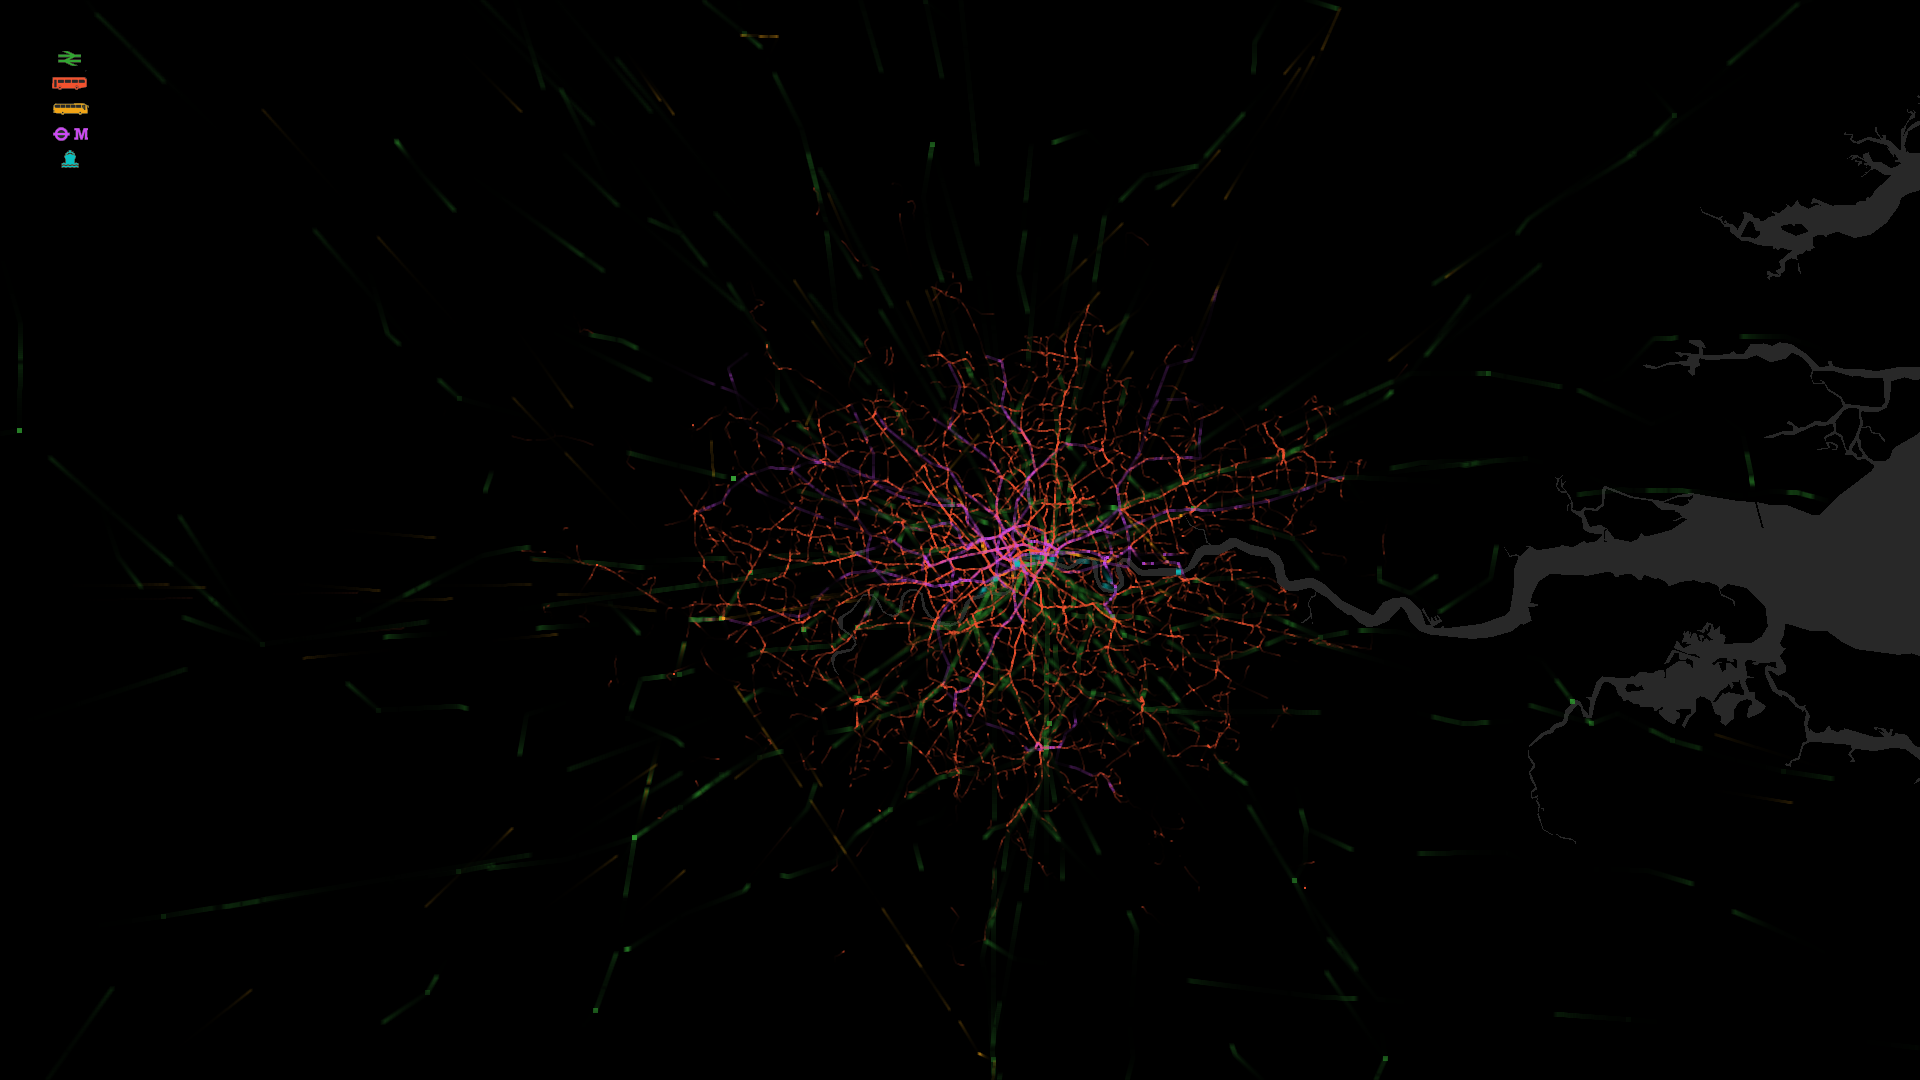
Figure 1. Snapshot of public transport services operating in London on a typical working day at 8:30am. Travel modes are colour coded: rail services in green, bus services in red, coach services (longer range bus service) in yellow, metro services in violet and ferry services in blue. More information on the visualisation available here. Click for a larger image.
While the potential of the data is huge, it also comes with many hurdles. We have more data, but often with lower explanatory power about the underlying decisions and behaviours of city users. Another important issue around some of these data types which is very relevant to us as urban modellers is its 'representativity' in our case study areas. In this sense, we are just starting to learn how to cope with this huge paradigm shift. In the past, behavioural patterns in the population data used in urban models were deduced using 1% population sample surveys (or similar values). From many of these new datasets we have now a much higher coverage, which can reach 40% or 50% of the population - but this sample size often comes at the expense of low quality, noisy or biased data. Data mining and the ability to blend data from multiple sources are becoming increasingly important for the identification of biases and inconsistencies in what can be quite gigantic datasets where billions of records are commonplace. Computational science enables us to process such data faster and new kinds of statistics based on data mining are essential for its analysis.
To make matters more complicated, the very same technologies which allow us to collect and use all this data have a much more important impact: research suggests that ICT is changing the way we live. Or, in other words, our daily activities in their various purposes (work, shopping, leisure or education to name a few) are being affected by the way we interact with our surroundings through ICT. Not just in the way we plan them but also in the way we get to interact with them and experience them. Urban models face a big challenge in capturing these behavioural changes.
EUNOIA is a European research project that investigates how data from multiple sources available in the context of the Big Data and the smart city movement (including data from smart cards, mobile phone traces, online social networks or credit cards, among others) can be integrated, analysed and visualised to understand mobility and location patterns in cities. New data sources can be used to replace or augment traditional data collection methods, but also to inform and enable the development of new modelling approaches. These in turn support researchers and practitioners with new insights about how city users live and move about in cities. Mobile phone data can be used to obtain origin-destination matrices at a much lower cost than from traditional household travel surveys, or can be combined with surveys to provide a richest pool of data. Data on credit card usage provides very rich information on expenditure flows across the city which can be used to formulate, calibrate and validate retail location models. Online social networks can be used to investigate the role of social interaction on mobility. The list is endless, and its exploration is still a largely unknown domain.

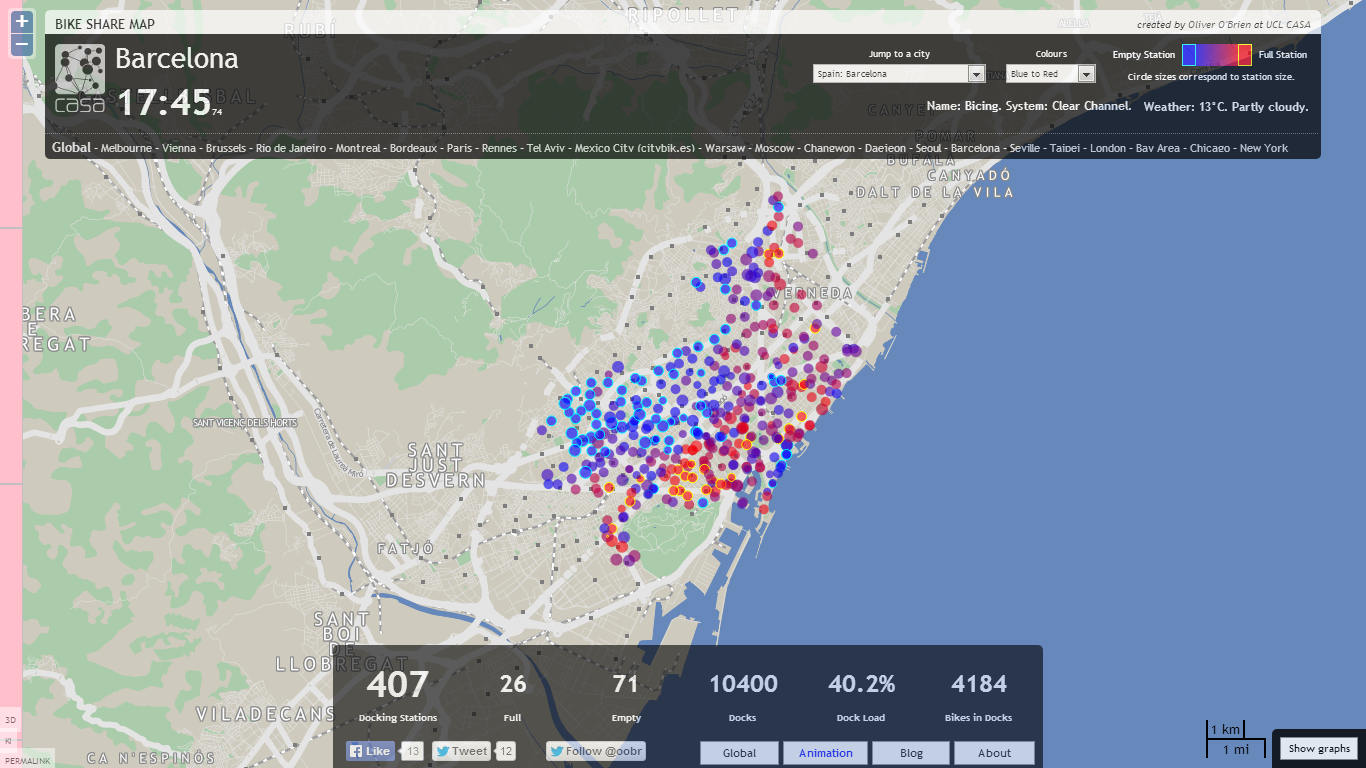
Figure 2. Snapshot of occupancy in bike share stations in Barcelona on the 14th of January 2014 (courtesy of Oliver O'Brien). See the live web application here. Click to view a larger image.
EUNOIA is looking at these and other questions with the aim of developing improved models and integrating them into large-scale, state-of-the art urban simulation tools, such as the agent-based transport simulation framework MATSim or the more aggregated LUTi framework SIMULACRA. The project also aims at developing user-friendly visual interfaces and data representations enabling analytical reasoning and interpretation of the simulation results. A number of case studies, defined in collaboration with planning authorities and mobility stakeholders from the three cities participating in the project (Barcelona, London, and Zurich) are aimed at evaluating the potential of the newly developed tools to address relevant policy questions, such as the planning and operation of the bike sharing systems in London or Barcelona.
Closing statements
Urban models have become a useful tool for planners to tackle many of the problems around the growth of cities. These models are now over 40 years old which means they have gone through many re-evaluations to improve their accuracy. Having said that, urban models still face many challenges ahead. We will emphasise four of them. First, they require a lot of computer processing power, especially regarding transport modelling. Fast and yet realistic implementations need to be sought to enable various model runs using shorter times. Second, the visual interface showing the results of LUTi models still has much room for improvement. More interactive and comprehensive tools to understand the results need to be implemented to help practitioners and other stakeholders. Third, there has been some discussion in the modelling community around the concept of dynamic versus static model implementations. As discussed by Ying and Wegener, this is a very challenging topic as it points to the core of the model design in order to better capture a world whose equilibrium is most likely dynamic. Finally, and perhaps most relevant in the context of our current research in EUNOIA, we need to find out whether more representative samples such as the ones from big data lead to potential advances in urban modelling. We believe breakthroughs in any of these areas will allow urban planners to be in a better position to tackle many of the challenges that cities are currently facing.
Back to Nordregio News Issue 1, 2014