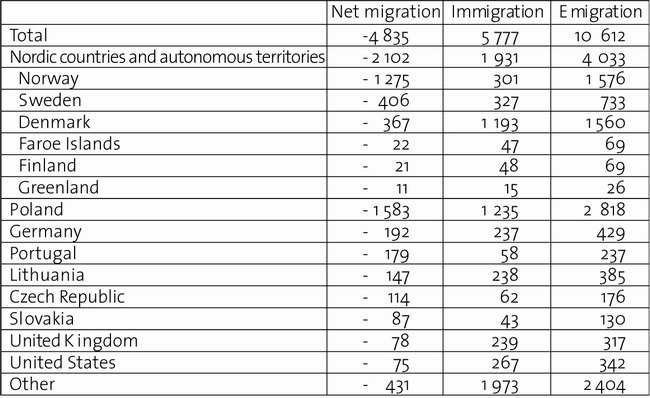
 In 2009 nine out of ten migrants from Iceland moved to another European country. The largest numbers of immigrants (2 800) left for Poland.
38% moved to another Nordic country or Nordic autonomous territory. 75% of these people moved to either Norway or Denmark. Each of these two countries received some 1500 immigrants from Iceland.
Sweden, Germany, Lithuania, the USA and the United Kingdom also received more than 250 immigrants from Iceland.
Poland also provided the highest number of immigrants to Iceland in 2009, with some 1 200. A third of all immigrants to Iceland came from other Nordic countries or autonomous territories, with Denmark providing the bulk of these, with 62% of the Nordic total.
Young emigrants
The gender composition of migrants to and from Iceland has also seen significant changes. Until 2003, the number of female immigrants to Iceland outnumbered the number of male immigrants. During the economic boom years of 2004-2007 the number of male immigrants outnumbered the females. Since 2008, the pre-2003 immigration pattern of females outnumbering males has reasserted itself.
In 2009, the modal age of emigrants from Iceland was 25 years. The age of immigrants was slightly lower with the 20-24 years age group the largest.
Brief boost in the greater Reykjavik area
Following the financial crisis internal migration in Iceland declined in 2009 as compared with 2008. In terms of the number of migrants per 1000 inhabitants the 2009 internal mobility rate has not been this low since 1987.
External migration displays a rather different pattern. Immigration to the rural areas of Iceland was particularly strong in the boom years 2005-2006. From 2003 to 2008 immigration of foreign citizens outstripped the net out-migration of Icelandic citizens from rural areas to Reykjavik or abroad. The rural areas saw a rapid dampening of net immigration in 2007, primarily due to a lower number of foreign immigrants, and suffered net emigration of both Icelandic and foreign citizens in 2008 and 2009. In terms of in- and out-migration the East experienced the largest shifts.
In the capital area of Reykjavik, a positive net migration was seen in 2005-2008, with a rapidly increasing inflow of labour migrants. Peaking in 2007, the migration pattern has experienced a total shift over the last 2 years. In 2009, the greater Reykjavik area had a net migration loss of 3 212 inhabitants. The majority of these, 54%, were Icelandic citizens. In comparison, the rest of Iceland experienced a net negative migration of 1 623 inhabitants. Of these the majority, some 56%, were foreign citizens.

Iceland net migration 2003-2009. Greater Reykjavik area vs. the rest of the country. Source: Statistics Iceland
By Jon M. Steineke, former Researcher at Nordregio