The collection of maps, “Major immigration flows to the Nordic Region 1990-2016”, highlights the increasing diversity of immigrants and explores the evolution of major immigration flows during three intervals between 1990 and 2016. The collection includes maps showing the Nordic Region as a whole, as well as more detailed accounts of the situation for individual countries.
Immigration has been the major source of population growth in the Nordic countries in recent years, accounting for two-thirds of the total increase since 1990. This trend has been particularly pronounced in the past decade, with over 2.9 million people immigrating to Nordic Region. At the same time, the primary countries of origin of immigrants to the Nordic countries have become increasingly diverse.
Between 1990 and 1999, Denmark and Sweden were the only Nordic countries to experience major immigration flows ( average annual flows of >3000 from a single country of origin) from countries outside the Nordic Region. In Norway and Finland, major flows during this period were limited to an exchange of people between the Nordic countries. Fast-forward just two decades and a strikingly different picture emerges.
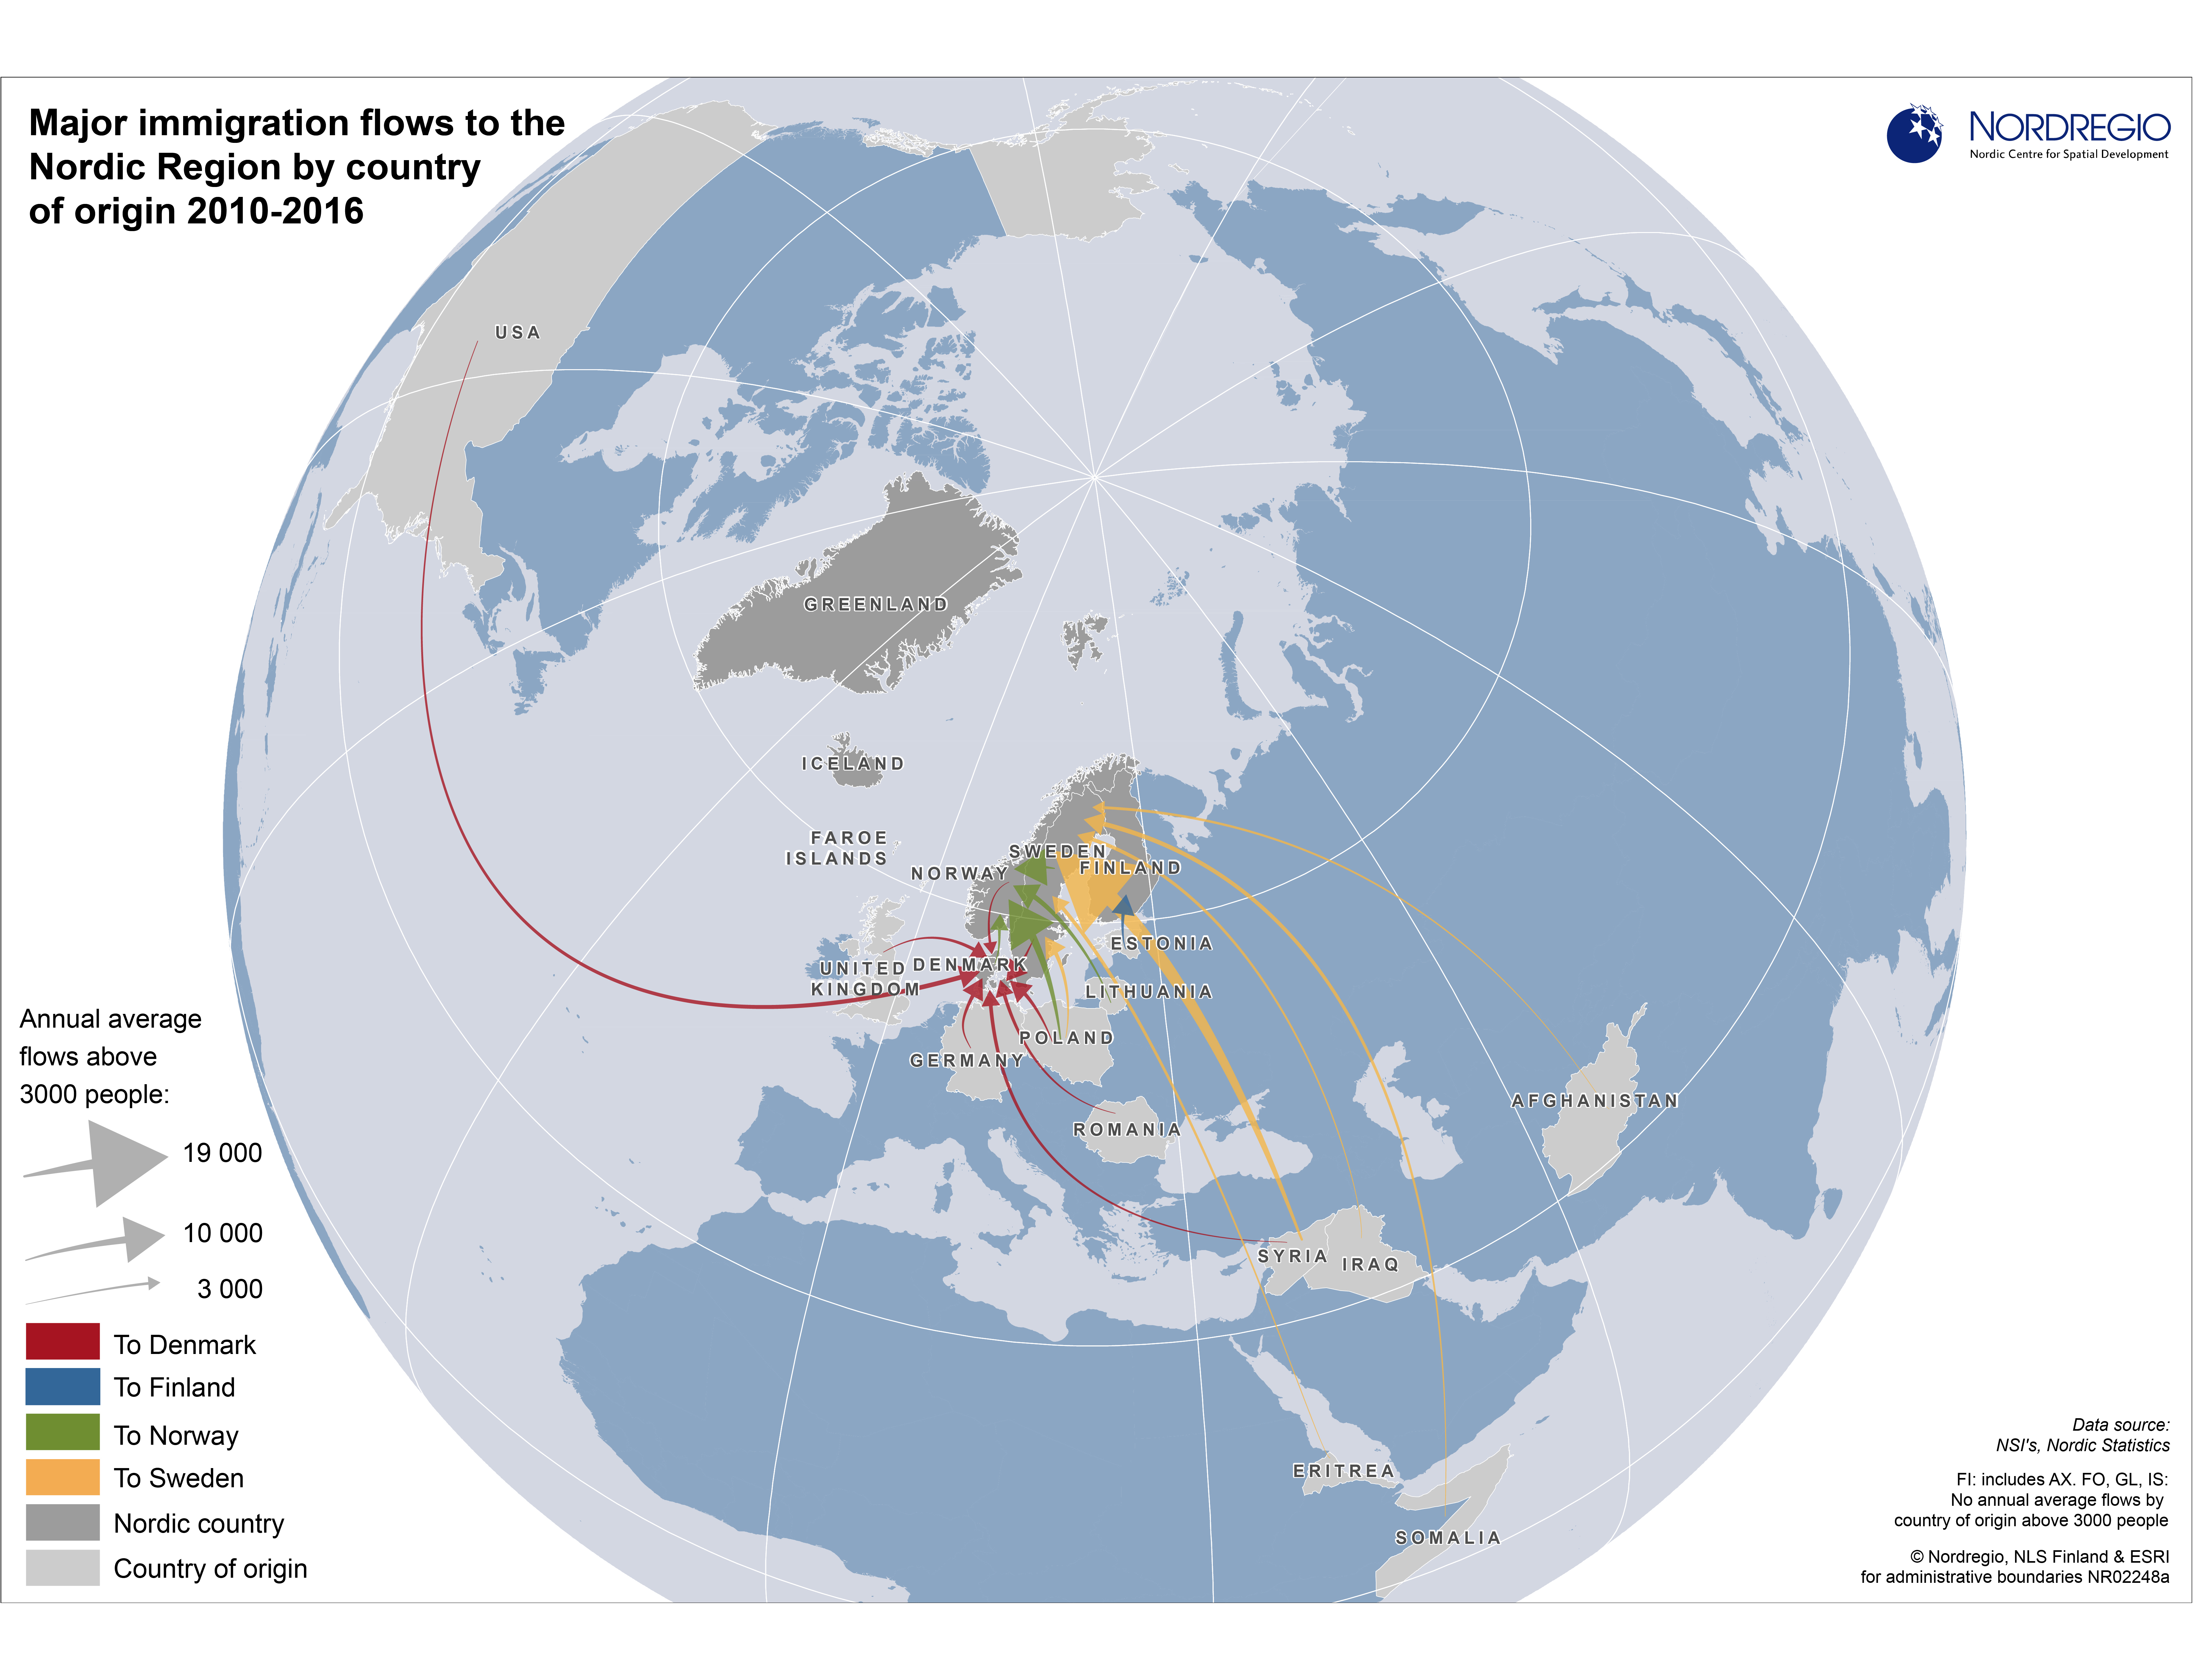
The map below shows immigration inflows to the Nordic countries from 2010-2016 which exceeded an annual average of 3000 people from a single country of origin. The size of the arrows equates to the average number of immigrants who came to the country each year during the period. The spatial patterns observed on the map illustrate increasing numbers of immigrants but also growing diversity in their countries of origin. Alongside this, the map reveals clear differences between the Nordic countries in both the dominant countries of origin and the size of inflows.
For Norway, large inflows were all from nearby countries: Sweden, Lithuania, Denmark, and Poland. Inflows from Poland were particularly high – an annual average of almost 11 000 people. Similarly, Finland had only one major inflow, from Estonia. Sweden and Denmark both experienced large inflows from further afield, with Sweden standing out as the Nordic country with by far the largest immigrant in-flows. A large portion of these arrivals were from Syria (an annual average of almost 19 000), followed by Somalia and Poland (5000 each), Iraq and Eritrea (4000 each), and Afghanistan, India, China and Iran (3000 each). Although Denmark experienced a similar number of inflows above 3000 people, the numbers were smaller and more evenly distributed than in Sweden. The largest inflows were around 5000 people and included migrants from the U.S., Sweden, Germany and Poland.
Due to their relatively small populations, the largest inflows to the Faroe Islands, Greenland and Iceland have remained under 3000 people during the period and, as such, do not appear on the Nordic maps. The situation in these countries is explored in several other maps in the series (see side panel) which show smaller flows on an individual country/ territory level. These maps reveal substantial flows from Denmark to both territories and to Iceland which can generally be explained by historic and political connections. Iceland also experienced a substantial inflow from Poland. This inflow was first observed during the period 2000-2009 and can largely be explained by the large numbers of Polish people who sought work in Iceland’s booming economy prior to the economic crisis in 2008.
Immigration flows are of growing interest due to the recent unprecedented numbers of immigrants arriving in the Nordic Region. Successful integration of these newcomers is vital to ensuring long-term social sustainability. The relatively young age structure of migrant populations also presents a great opportunity to address the challenge of population ageing currently faced by all Nordic countries. Use the links to the left to explore the complete collection of maps Major immigration flows to the Nordic Region 1990-2016. You can also learn more about immigration on the regional and municipal level though other related maps in the Nordregio map gallery and Nordic projects on the theme of integration.
>> Download the map to zoom in
Related projects
Cartographer: Linus Rispling
Data source: NSIs, Nordic Statistics
"Map of the Moment" is frequently updated with the selected map as the representation of the map production at Nordregio.