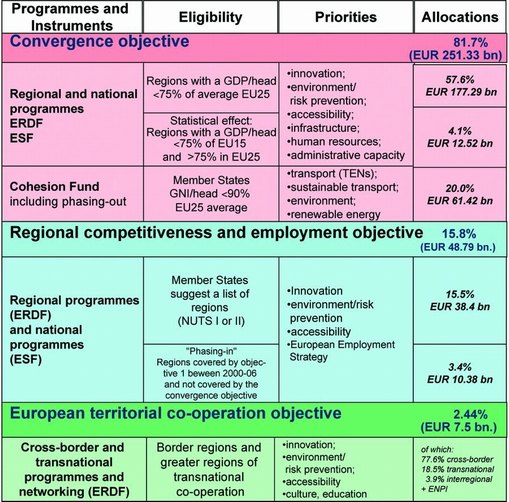
The EU-Commission defines cohesion policy as the merge of three different objectives: Convergence, regional competitiveness and employment as well territorial cooperation. The total allocations earmarked for these three objectives are 307.6 billion euros or 35.7 percent of the total budget for 2007-2013.
As seen from the slide (provided by the European Commission) below, convergence receives the largest share with a total of 251.33 billion.
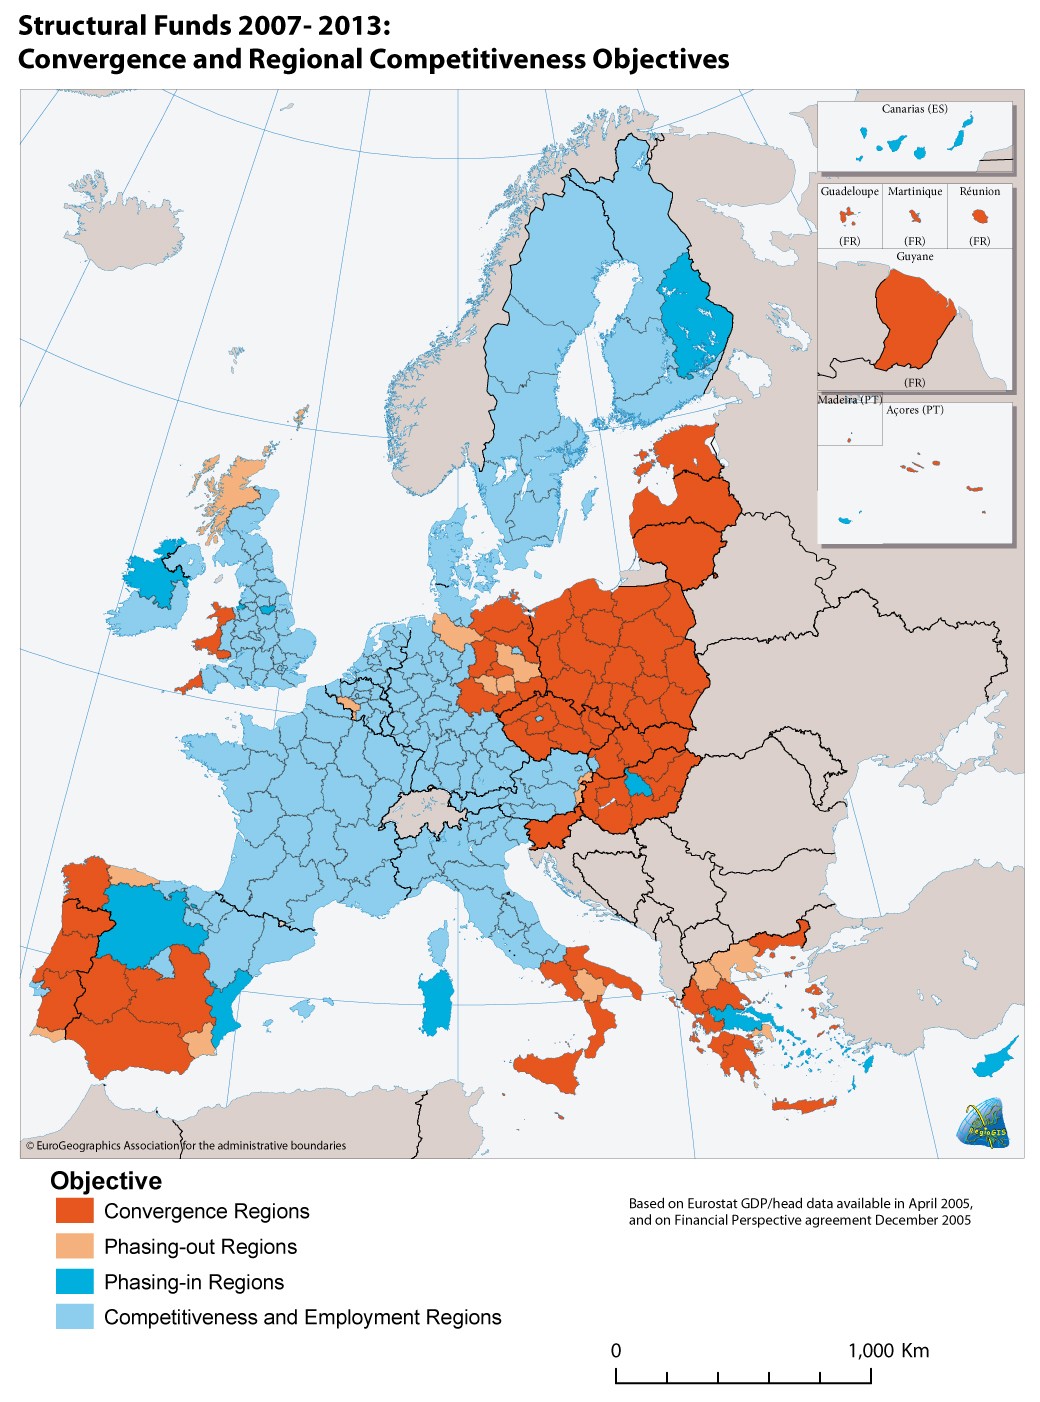
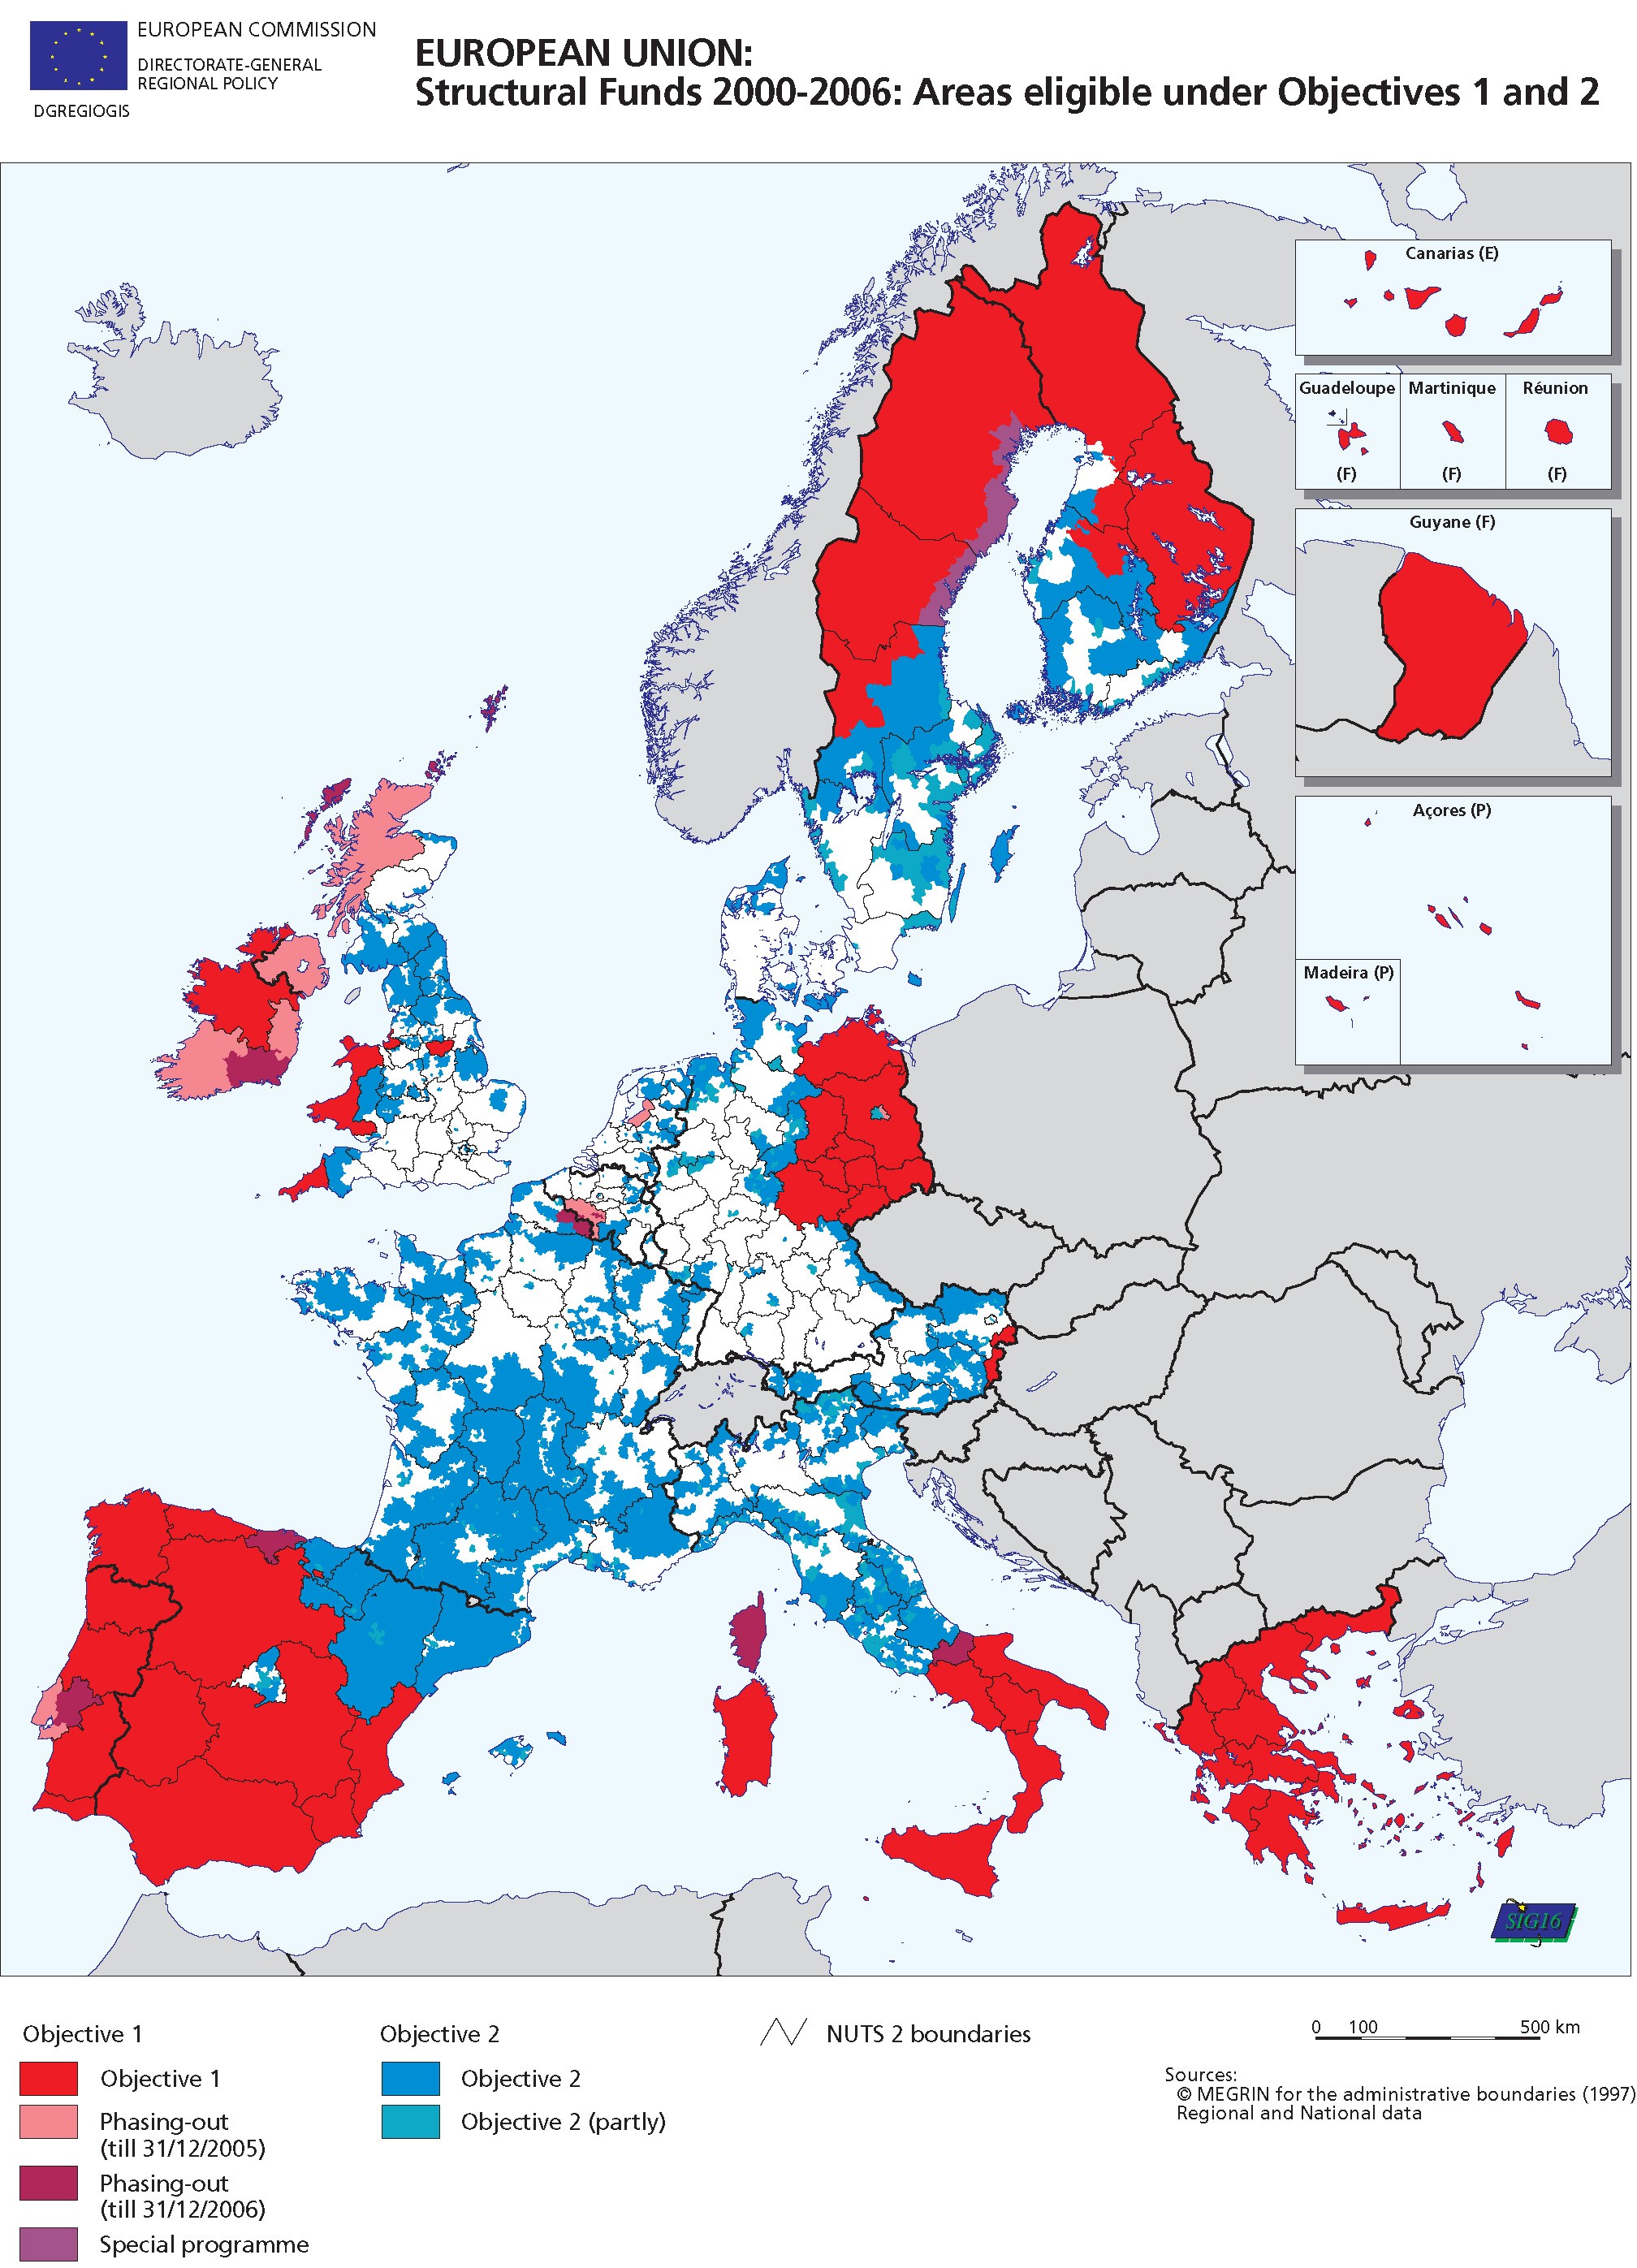
Quite a large part of this is ERDF (European Regional Development Fund) or what also has been included under the term Structural Funds. The two next pages (14+15) present which areas or regions are eligible for what, both in the new and the previous budget period.
Finally, on page 14, we also provide an overview of cohesion-allocation in the 2007-2013-budget per country and capita.

Srucural Funds 2007-2013:
Convergence and Regional Competitiveness Objectives

Convergence Regions: Allocated 177.8 billion euros. 86 regions, capita GDP less than 75 % of the EU-25 average. 124 million inhabitants or 27.3 % of EU population.
Phasing-out (of the Convergence objective) Regions: Allocated 12.5 billion euros. 16 regions, capita GDP has increased to exceed 75 % of EU-25 average. 16.4 million inhabitants or 3.6 % of EU population.
Phasing-in(to the Regional Competitiveness and Employment objective) Regions: Allocated 10.4 billion euros. 13 regions, capita GDP of more 75 % than EU-15 average (82.2 % of EU-25 average). 19 million inhabitants, 4.2 % of EU population.
Competitiveness and Employment Regions: Allocated 38.4 billion euros. 156 regions or the rest of the EU, capita GDP above 75 % of the EU-25 average. 296 million inhabitants, 65.1 % of EU population.
EU Cohesion policy 2007-2013:
Indicative financial allocations(billion EUR) (Source: European Commission)
| Country |
|
Total sum (billion EUR) |
|
Per capita (EUR) |
|
| 1 Poland |
|
59.70 |
|
1.563 |
|
| 2 Spain |
|
31.54 |
|
746 |
|
| 3 Italy |
|
25.65 |
|
443 |
|
| 4 Czech Republic |
|
23.70 |
|
2.326 |
|
| 5 Germany |
|
23.45 |
|
284 |
|
| 6 Hungary |
|
22.45 |
|
2.223 |
|
| 7 Portugal |
|
19.15 |
|
1.857 |
|
| 8 Greece |
|
18.22 |
|
1.656 |
|
| 9 Romania |
|
17.32 |
|
777 |
|
| 10 France |
|
12.74 |
|
213 |
|
| 11 Slovakia |
|
10.26 |
|
1.900 |
|
| 12 United Kingdom |
|
9.49 |
|
159 |
|
| 13 Lithuania |
|
6.10 |
|
1.794 |
|
| 14 Bulgaria |
|
6.05 |
|
807 |
|
| 15 Latvia |
|
4.09 |
|
1.778 |
|
| 16 Slovenia |
|
3.74 |
|
1.870 |
|
| 17 Estonia |
|
3.06 |
|
2.186 |
|
| 18 Belgium |
|
2.02 |
|
194 |
|
| 19 Nederlands |
|
1.70 |
|
104 |
|
| 20 Sweden |
|
1.68 |
|
187 |
|
| 21 Finland |
|
1.53 |
|
294 |
|
| 22 Austraia |
|
1.30 |
|
160 |
|
| 23 Ireland |
|
0.82 |
|
205 |
|
| 24 Malta |
|
0.76 |
|
190 |
|
| 25 Cypros |
|
0.58 |
|
823 |
|
| 26 Denmark |
|
0.55 |
|
101 |
|
| 27 Luxembourg |
|
0.06 |
|
120 |
|
| Not allocated |
|
0.40 |
|
|
|
| TOTAL |
|
308.04 |
|
|
|

Objective 1: To promote the development and structural adjustment of regions whose development is lagging behind (i.e. with low population density and/or capita GDP less than 75 % of EU-15 average). In total, some fifty regions or 22 % of EU-population.
Objective 2: To revitalise, i.e. to promote economic and social conversion and modernisation of regions facing structural difficulties (industrial, rural and urban areas and areas dependent on fisheries). Includes about sixty areas notably in the UK, Spain, France and Germany.